| Complexity level: | 7 |
| Project cost ($): | 30 |
| Time required: | 1 hour to prepare, 2 hours for the science project experiment |
| Material availability: | Easily found |
| Safety concerns: | Basic safety requirements |
Hypothesis
Overview
Scientific Terms
Materials
Procedure
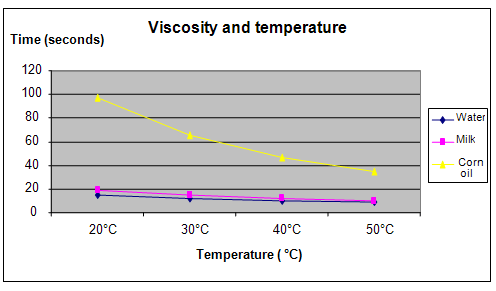
Results
It was observed that water had the fastest rate of flow and the corn oil had the slowest. The flow rate of water, milk and corn oil increased as the temperature increased.
|
Adhesive material |
Viscosity and flow rate of water, milk and corn oil at different temperatures (seconds) |
|||
|
20°C |
30°C |
40°C |
50°C |
|
|
Water |
15 |
12 |
10 |
9 |
|
Milk |
19 |
15 |
12 |
10 |
|
Corn oil |
97 |
65 |
47 |
35 |
The graph below represents the results of our science fair project:

Conclusion
Also consider
References
Related videos
Hey there! Here are some awesome videos about this science project that we think you'll really like. They're not only super fun, but they'll also help you learn more about the science behind the project. So sit back, relax, and get ready to have some fun!!