| Complexity level: | 5 |
| Time required: | 1 hour for preparation, 2 days for experiment |
| Safety concerns: | Be careful of road vehicles - Adult supervision required. |
Hypothesis
Air pollution will be the most severe in the early mornings and late evenings, during peak hour traffic.
Overview
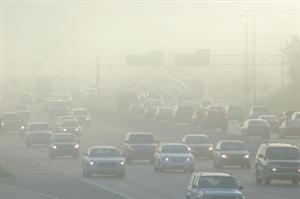
Vehicle gas emissions
Motor vehicles consume gasoline and release several types of gaseous pollutants into the environment. These pollutants may cause poor visibility, respiratory problems such as asthma, and may even affect the quality of fresh water.
Among the pollutants released by motor vehicles are hydrocarbons, carbon monoxide, nitrogen oxides, sulfur oxides and other particulates. Hydrocarbons are partially burned fuel and are toxic. They can cause liver damage and cancer. Carbon monoxide reduces our blood’s ability to carry oxygen, so overexposure to it may be fatal. Nitrogen oxides affect our resistance to respiratory infections. Similarly, particulates from vehicle fumes can cause respiratory problems.
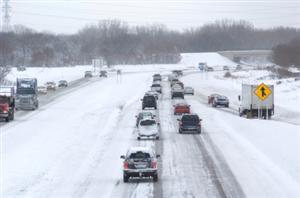
Good driving habits and a well-maintained car can help reduce pollution emitted on roads. Most vehicles are most efficient at speeds between 55km/h to 75km/h. Within this speed range, the least amount of fuel is consumed and the least amount of pollution is emitted. In contrast, driving in heavy traffic causes one to accelerate and brake frequently, which consumes more fuel as well as releases more polluting gases.
Scientific Terms
Materials
The materials required for this science fair project:
- Highway route with speed limit of 90km/h
- 1 video camera with a stand
- Raised location to set the camera up and to view traffic
- 1 stopwatch
Procedure
1. For this science fair project, the independent variable is the time of the day traffic is monitored. The dependent variables are the vehicle speed, traffic volume and traffic flow. This is determined by observing the video recording. The constants (control variables) are the chosen location, the day of the observation and the viewing range of the video recording.
2. Choose a raised location along a highway with a 90km/h speed limit. Set up the video camera and adjust it to capture an unobstructed view of a 200m stretch of the highway.
3. Set the timer in the video camera to start at 6:00am and to finish at 12:00 midnight. After the 18-hour recording is completed, analyze the recording.
4. Divide the recording into 6 time windows of 3 hours each, namely, 6am to 9am, 9am to 12pm, 12pm to 3pm, 3pm to 6pm, 6pm to 9pm and 9pm to 12am.
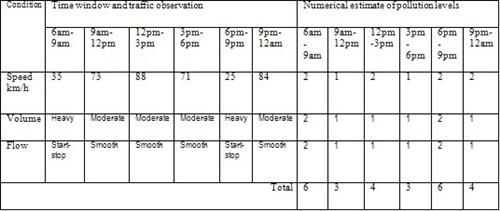
5. From the video, observe the following:
a. Traffic speed – use the time taken by the vehicles to travel the 200m to estimate the vehicle speed.
Speed = 60 x 200 m / (time for 200m in minutes)
Use the formula above and record your results in the table below.
b. Traffic volume – use the number of vehicles on the road to define traffic volume. If there are more than 300 vehicles on the road within the 3 hour window, consider the traffic as high; otherwise, consider it moderate.
c. Traffic flow – consider continual movement of traffic as “smooth”, and traffic that moves, stops and idles as “halting”.
6. Assign numerical values to the observations recorded in step 5, as follows:
a. Traffic speed
1- Value = 1 when speed is between 55 and 75 km/h (this indicates less emissions)
2- Value = 2 in the case of other speeds (this indicates higher emissions)
b. Traffic volume
1- Value = 1 when there is moderate traffic volume
2- Value = 2 when there is high traffic volume
c. Traffic flow
1- Value = 1 when there is smooth-flowing traffic
2- Value = 2 when there is halting traffic

Results
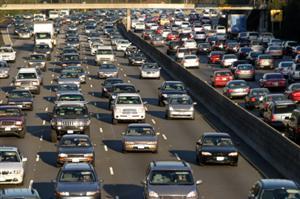
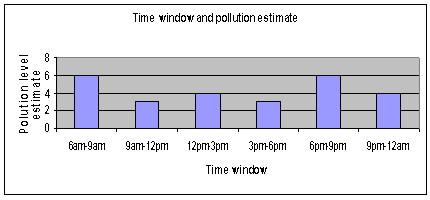
The results show that pollution emitted by vehicles is the highest during peak hours - 6am to 9am, and 6pm to 9pm.
The above results were then plotted onto a graph, as shown below.
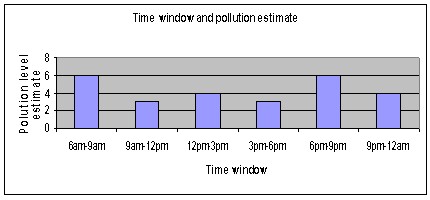
Conclusion
The hypothesis that pollution will be highest during the peak hours in the early morning and late evening, due to high traffic, has been proven to be true.
Pollutant gases released from fuel combustion in motor vehicle engines has significant effects on our environment. They also negatively affect the health of humans and animals. Many regulations have been introduced to regulate vehicle emissions. The use of hybrid vehicles fitted with electric enginse help to reduce gasoline consumption and lessen the emission of pollutant gases.
Also consider
The science fair project may be repeated with diesel-operated vehicles, like busses and trucks, to test for differences in the levels of pollutants emitted.
The experiment may also be repeated in other areas, like more urban or residential areas, to test for differences in the levels of pollutants emitted.
References
Air quality – vehicle emissions and air quality - http://www.deq.state.id.us/air/prog_issues/pollutants/vehicles.cfm
Vehicle emissions control - http://en.wikipedia.org/wiki/Vehicle_emissions_control