Search for Science Fair Projects

1000 Science Fair Projects with Complete Instructions

Pollution and Road Traffic

Pollution and Road Traffic

Hard
Share this Science Project:
This page contains full project details. For the summary, please see the Project Summary.

Science Fair Project Description

This science fair project was performed to better understand the relationship between road traffic flow and emission pollution at different times of the day. The science project involved monitoring traffic conditions beside a highway - including average traffic speed, the number of vehicles and flow patterns.
Complexity level:8
Project cost ($):30
Time required:1 hour to prepare, 2 days for science project experiment
Material availability:A video camera and adjustable stand is required
Safety concerns:Adult assistance required. Be careful when you’re on the road. Choose an observation point that is safe and observe all road safety rules.

Hypothesis

Emission pollution will be at its highest in the early mornings and late evenings, due to heavier road traffic.

Overview

Vehicle gas emissions

Motor vehicles run on gasoline. Several types of pollutant gases are released into the environment as a by-product of the combustion process that takes place within combustion engines. These pollutants cause poor visibility (smog), respiratory problems such as asthma and even affect threaten the cleanliness of our water supply sources, such as our reservoirs and lakes.

Among the pollutants that are released by motor vehicles, are hydrocarbons, carbon monoxide, nitrogen oxides, sulfur oxides and other particulates. Hydrocarbons are essentially partially burned fuel they are extremely toxic. They cause liver damage and cancer. Carbon monoxide reduces the ability of blood to carry oxygen and overexposure to it can be fatal. Nitrogen oxides affect our resistance to respiratory infections. Particulates from vehicle fumes can also cause respiratory problems.

Good driving habits and a well maintained car help to reduce the pollution emitted by vehicles. Most vehicles run most efficiently at speeds between 55km/hour to 75km/hour. At this speed, the least amount of fuel is consumed and the least amount of pollution is emitted for the distance traveled. Avoid driving during peak hours, as driving in heavy traffic results in frequent accelerating and braking - and this leads to higher fuel consumption and increased pollution.

Scientific Terms

Pollutant gasses, hydrocarbon, carbon monoxide, nitrogen oxides, sulfur oxides

Materials

The materials required for this science fair project:
- 1 highway route with a speed limit of at leaset 90km/h
- 1 video camera mounted on an adjustable stand
- sufficient video tape or memory cards
- 1 elevated location to set up the camera and to film the traffic
- 1 stopwatch

Procedure

1. For this science fair project, the independent variable is the window of time allotted for monitoring the passing vehicles. The dependent variable is the average vehicle speed, volume of traffic and rate of traffic flow. This is determined by first recording the flow of traffic with the video camera, and carefully reviewing the recording. The constants (control variables) are the chosen location, the day of observation and the viewing range and angle of the video camera.

2. An elevated location is chosen along a highway. The video camera is set up using  the stand and adjusted so that a 200 meter long stretch of the highway can be clearly observed in the recording.

3. The record the flow of traffic from 6:00am to 12:00 midnight. You may need to replace the tape/memory card regularly. Ensure that you do so at regular intervals (for example, after every 2 hours and 59 minutes). After the 18 hours recording is completed, retrieve your equipment and analyze your recording.

4. The recording is divided into 6 windows of 3 hours each. The time windows are 6am to 9am, 9am to 12pm, 12pm to 3pm, 3pm to 6pm, 6pm to 9pm and 9pm to 12am.

5. From the video recording the following data is collected :

a. Traffic speed – the time taken by the vehicles to travel the 200 meters is used to estimate the vehicle speed.

Speed = 60 x 200 m / (time for 200 m in minutes)

The speed of several vehicles for window of time  is estimated as above and their average speed is calculated and recorded in the table given below.

b. Traffic volume – the number of vehicles on the road is used to define the traffic volume. If there were more than 300 vehicles on the road within the 3 hour window, the traffic volume will be recorded as high, otherwise it will be considered as moderate.

c. Traffic flow –continuous movement of traffic will be considered smooth while traffic that moves, stops and idles  frequently is considered as “start-stop”.

6. The definitions given in procedure 5  are further translated  into numerical values on the following assumptions:

a. Traffic speed

1- speed between 55  and  75 km/hour (most efficient with the least amount of emission)

2- other speeds (less efficient and result in higher emissions)

b. Traffic volume

1- moderate traffic flow (less vehicles on the road and less emission)

2- heavy traffic flow (more vehicles on the road and more emission)

c. Traffic flow

1- smooth flowing traffic (consumes less fuel and less emission)

2- start-stop traffic (consumes more fuel and more emission)

A pollution index for each time slot is calculated by adding up the scores for all three sections (speed, volume and flow).

b1.gif

Results

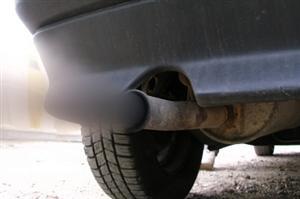
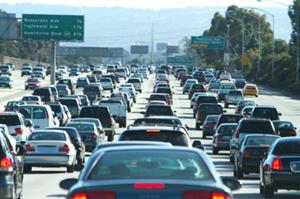
The results showed that pollution emitted by vehicles will be highest during peak hours between 6am  and 9am and from 6pm to 9pm, as evidenced by the total score (pollution index).

Condition

Time window and traffic observation

Numerical estimation of pollution

6am-9am

9am-12pm

12pm-3pm

3pm-6pm

6pm-9pm

9pm-12am

6am-9am

9am-12pm

12pm-3pm

3pm-6pm

6pm-9pm

9pm-12am

Speed km/h

35

73

88

71

25

84

2

1

2

1

2

2

Volume

Heavy

Moderate

Moderate

Moderate

Heavy

Moderate

2

1

1

1

2

1

Flow

Start-stop

Smooth

Smooth

Smooth

Start-stop

Smooth

2

1

1

1

2

1

Total

6

3

4

3

6

4

The chart below represents the results of our science project:

road traffic flow and pollution science project

Conclusion

Emission pollution was at its highest in the early mornings and late evenings, due to heavier road traffic. Our hypothesis has been proven correct.

The pollutant gases released from the combustion of fuel in motor vehicles has significant effects on our environment and the health of living organisms. Many regulations have been introduced to curb vehiular emissions. Further, the use of hybrid vehicles fitted with electric engines has helped to reduce gasoline consumption and the emission of pollutant gases.

Also consider

The science fair project can also be repeated in other areas like in the city or residential areas. Do temperature and wind conditions affect the level of pollution along our highways?

References

Air quality – vehicle emissions and air quality - http://www.deq.state.id.us/air/prog_issues/pollutants/vehicles.cfm

Vehicle emissions control - http://en.wikipedia.org/wiki/Vehicle_emissions_control

Related video

Hey there! Here are some awesome videos about this science project that we think you'll really like. They're not only super fun, but they'll also help you learn more about the science behind the project. So sit back, relax, and get ready to have some fun!!
Share this Science Project:

Related Science Fair Project Ideas

Measuring Carbon Monoxide Emissions
Let's find out how much carbon monoxide is released by cars of different ages!
Hard
Acid Rain's Effect on Sunflower Growth
Does acid rain affect the growth of sunflowers? Find out by testing different pH levels of water on sunflower plants!
Hard
Acid Rain and Building Materials
Does acid rain dissolve buildings? Find out by testing marble, limestone, granite, and bricks in vinegar!
Hard