Does rush hour traffic really produce more pollution than midday traffic? Slow speeds and stop-and-go driving burn fuel less efficiently. This project creates a pollution index from real traffic data.
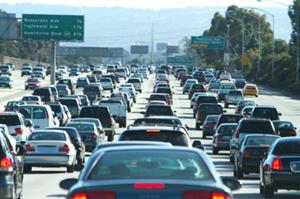
You set up a video camera overlooking a 200-meter stretch of highway. You record from 6 a.m. to midnight and split the footage into six 3-hour windows. For each window, you estimate average speed. You also count vehicles and note the flow pattern.
You then score each factor and add them up to compare pollution levels across the day.
Hypothesis
The hypothesis is that emission pollution will be at its highest in the early mornings and late evenings, due to heavier road traffic.
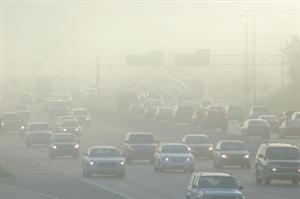
Stop-and-go driving during rush hour burns fuel less efficiently, pushing more gases and particles out of the exhaust pipe. One experiment captures this directly: a video camera records an 18-hour stretch of highway traffic, splitting the footage into six 3-hour windows. For each window, you estimate average speed, count vehicles, and note the flow pattern. Those factors combine into a pollution index that makes it possible to compare emission levels across the day.
Stop-and-go driving burns fuel less efficiently than steady cruising, which means rush hour traffic may release more harmful substances into the air than midday traffic does. To test this, you set up a video camera overlooking a 200-meter stretch of highway and record from 6 a.m. to midnight. Splitting the footage into six 3-hour windows, you estimate average speed, count vehicles, and note the flow pattern for each. Scoring those factors and adding them up produces a pollution index that shows how driving patterns shift air quality across the day.
Method & Materials
You will set up a camera to observe a 200 meter stretch of highway, record the flow of traffic for 18 hours, and analyze the data.
You will need a video camera, adjustable stand, video tape or memory cards, and a stopwatch.
Eureka Crate — engineering & invention kits for ages 12+ — monthly projects that build real-world skills. (Affiliate link)
Our results showed that pollution emitted by vehicles was highest during peak hours between 6am and 9am and from 6pm to 9pm. This proves our hypothesis correct.
Why do this project?
This science project is interesting because it shows how our driving habits can have a direct impact on the environment.
Also Consider
Consider repeating the experiment in other areas like in the city or residential areas. Also, investigate how temperature and wind conditions affect the level of pollution along our highways.
Full project details
Additional information and source material for this project are available below.