
The Scientific Method Guide: 7 Steps of the Scientific Method, An Example & The History
What is the scientific method?
The 7 steps of the scientific method
Scientific method example
Scientific method history
What is the scientific method?
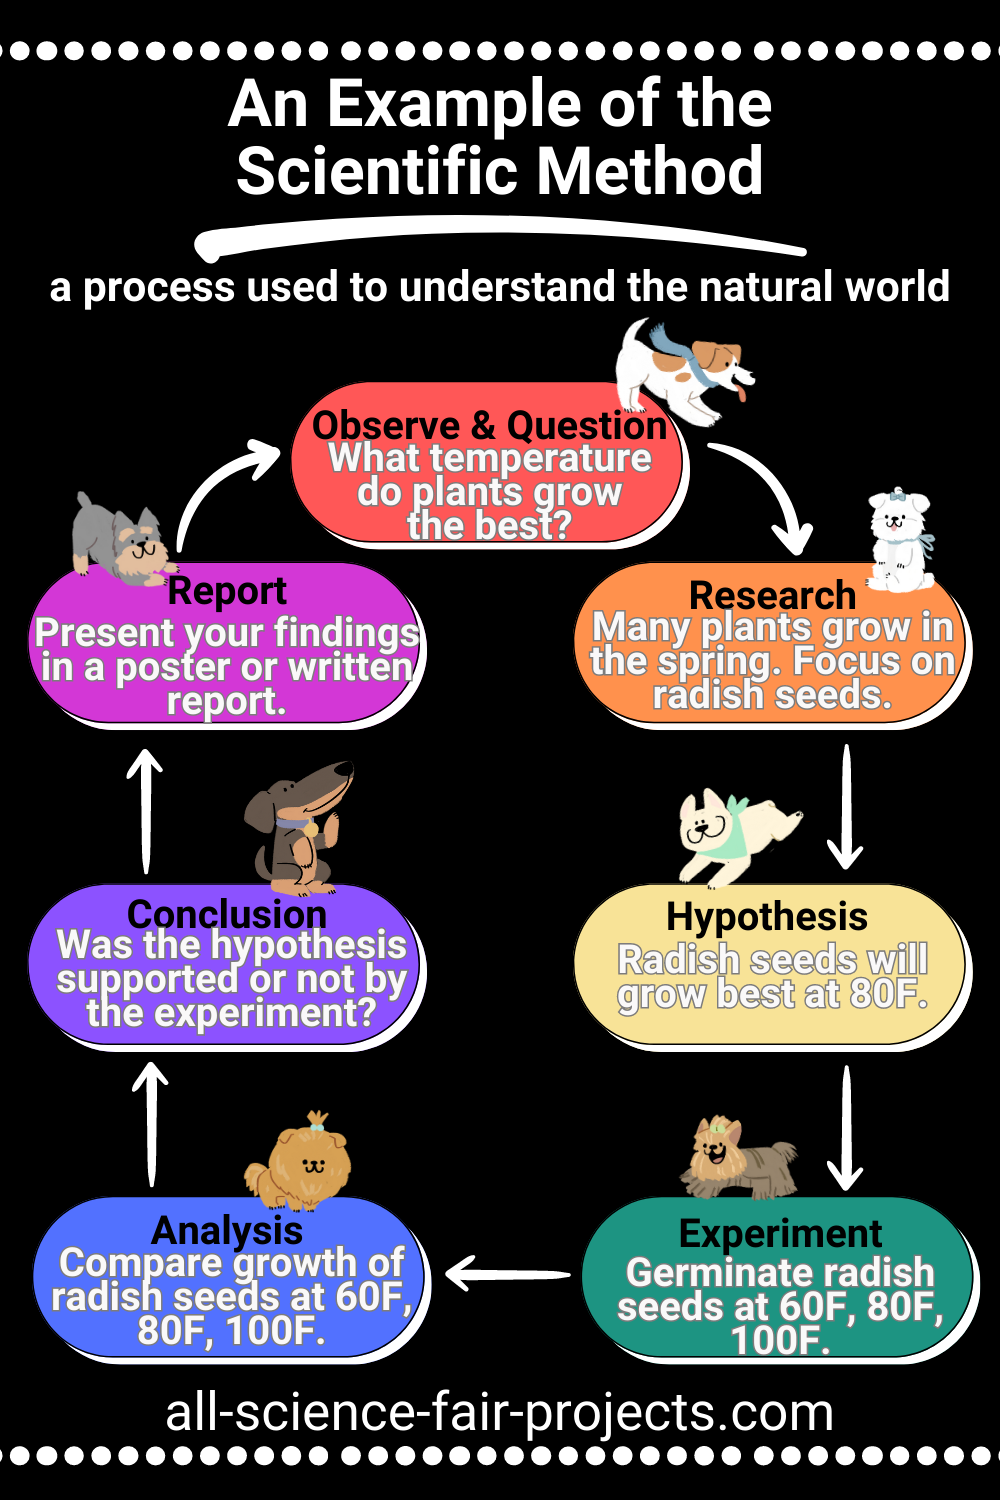
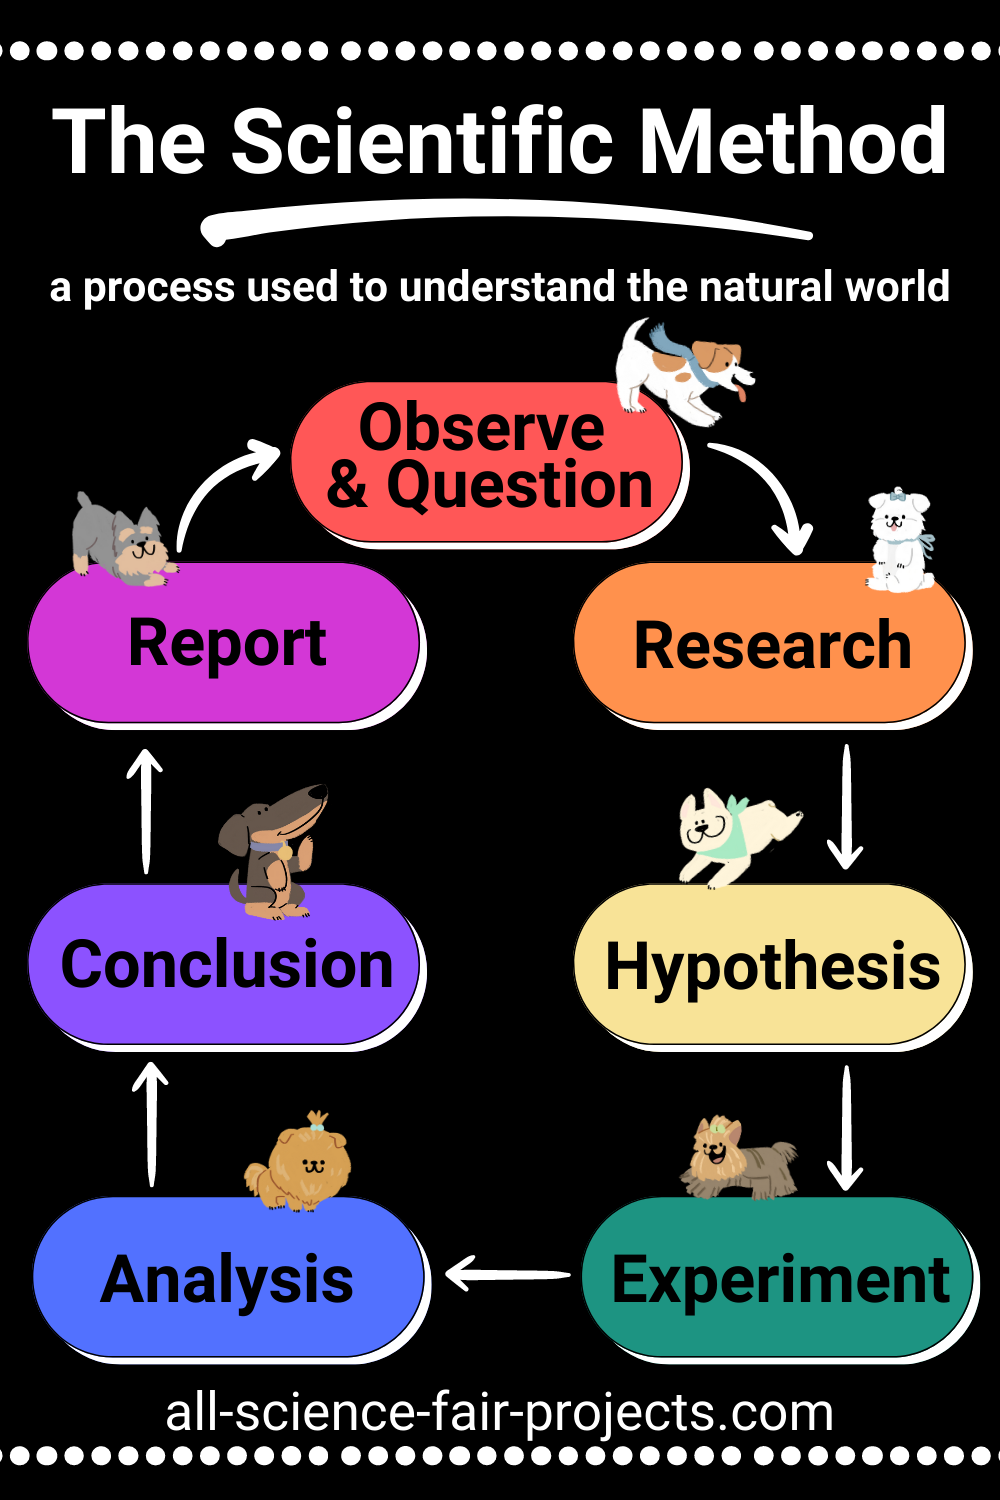 The scientific method is a process used to understand the natural world. It’s not a rigid set of rules, but rather a flexible guideline that can be changed to complement the creativity and curiosity that drives scientific research. Scientific concepts are tested and refined through multiple rounds of the scientific method.
The 7 Steps of the Scientific Method
Observe and Question
Observe something in nature and ask a question about it.
Why is it like this?
How does it work?
Does changing one thing affect what you see?
Let’s use the example of exploring how temperature affects plant growth. Does changing the temperature affect how plants grow? What temperature do plants grow the best, in the hot or in the cold?
 Research
When you research and learn more about the topic, it will help you ask more specific questions about your topic that you can explore in your experiment.
In our example of plant growth, research shows that most plants grow best during the spring when temperatures are warming up. But is there one temperature that plants grow the best? Since there are many different kinds of plants, in this example we’ll focus on radish seeds.
Make a Hypothesis
A hypothesis is an educated guess or scientific theory that uses previous knowledge about the topic to answer a question.
For radish seed growth, a good guess is that radish seeds will grow best at a temperature slightly higher than room temperature, at 80F. The hypothesis could be stated as: “The hypothesis is that radish seeds will grow best at 80F, compared to lower or higher temperatures.”
Plan & Do an Experiment
The experiment tests whether the hypothesis is supported.
Plan and do the experiment with the following steps:
Independent variable & dependent variable
Control group & experimental group
Positive control & negative control
Reproducibility
Gather materials
Collect data & careful observation
1) Independent Variable & Dependent Variable
To find the cause and effect relationship between the two things, you can change one thing to see what happens to the other. To plan a good experiment of this nature, identify the independent variable and dependent variable:
The independent variable is the thing that is changed.
In the plant growth experiment, the temperature is the independent variable that is changed. All other factors, such as the type of seeds, the type and amount of soil and water will be kept the same.
The dependent variable is what is measured in the experiment.
In the plant growth experiment, the dependent variable is how long the plant grows because we’re trying to see how plant growth is dependent on the temperature.
2) Control group & experimental group
The control group is an important part of an experiment. It's a standard to which the results of the experimental group are compared. The control group is usually a set of conditions for which we already know the results - both positive and negative, which we'll discuss below. In the experimental group, the independent variable is changed to observe its effect on the dependent variable.
In the plant growth experiment, the control is radish seeds grown at room temperature, where it's known that the seeds will sprout. The experimental groups are the radish seeds grown at higher and lower temperatures.
3) Positive Control & Negative Control
In some kinds of experiments, you want to know that the experiment is setup is working correctly. With both a positive and negative control in an experiment where you test “X” on your experiment setup, you have greater assurance that the result you get with “X” is valid.
The positive control is a sample or condition in the experiment that is expected to cause an effect as a reference for comparison.
The negative control is a sample or condition used in the experiment that is expected to have no effect or show no change in order to provide a baseline comparison.
It’s easier to see the need for a positive and negative control with an example.
To determine if dog saliva has more microbes than human saliva, you can compare both saliva samples by placing them on agar plates. However, before conducting the experiment, it's crucial to ensure that your experimental setup is accurate. This involves including positive and negative controls to validate your findings.
A negative control, which lacks any saliva sample, is essential to confirm that any microbes observed are indeed from the saliva samples. This control helps identify any potential contamination of the agar plates with microbes not originating from the saliva samples. If the negative control shows microbial growth, it suggests that the microbes growing on the saliva samples may not be solely from the saliva samples.
Similarly, a positive control with known microbes can verify that microbes can grow on the agar plates. If the positive control does not show any microbial growth, it indicates that there may be an issue with the experimental setup, and any conclusions drawn about the growth or lack thereof in the saliva samples may not be reliable.
4) Reproducibility
Reproducibility of an experiment means that when you repeat the experiment, you get the same result. For results to be true, they need to be reproducible.
As you plan the experiment out, consider the best way to repeat the experiment. With some experiments, you can do multiple experiments at the same time. You can also repeat the entire experiment on another day and see if you get the same results.
A good rule of thumb often used in scientific research laboratories is to aim for consistent results at least three times in a row. Getting three identical results out of six attempts doesn't count!
For example, in the plant growth experiment, you can test 10 radish seeds in one experiment at a specific temperature. This allows you to obtain an average growth rate of the radish seeds at that temperature.
What do you do if the experiment results aren’t reproducible? It’s time to troubleshoot! There could be factors not accounted for that are changing each time you do the experiment. Identifying and addressing these factors can help improve the reproducibility of your experimental results.
For instance, in the plant growth experiment, if the results were not reproducible, it could be due to natural variation in seeds, differences in soil type, or variations in water quality used. These could each be investigated in further rounds of the scientific method.
5) Gather Materials
With the experiment planned out, you can now gather the materials you need for the experiment. It's a good idea to get a few extras of each item, as there may be unexpected surprises where having a spare could come in handy!
6) Collect data
Systematic observation is important when collecting data. Keep good records from the start of the experiment. This means noting down the conditions when the experiment was done, such as the day, time, and/or temperature. If there are any changes to the procedure when you actually do the experiment, be sure to note those down as well. It's important to know exactly what was done so you can have all the correct information when you analyze the data later on.
When it's time to collect the data, make accurate measurements. Even if the results do not match what you expect, record exactly what you measure. In addition, an important aspect of experimental data is to make careful observations of things you may not have expected. These new observations can be starting points for future experiments. Many scientific discoveries were made from unexpected experimental results!
 Analysis
After gathering all the data from the experiment, it’s time to understand what it means!
Keep in mind that the results from the experiment may not give a clear answer. Don’t be discouraged as experiments often are not perfect ways to understand the complexity of science!
Calculations: Do any calculations with the data to extract the information needed.
In the plant growth experiment, the length of the germinated seeds at each temperature can be averaged.
Organize data: Organize the data to make it easier to see any patterns: a table, a line graph, a bar graph, or a pie chart.
The data from the plant growth experiment can be graphed into a bar graph, with temperature on the x-axis, and the average length of the plant growth on the y-axis.
Dependent and independent variable: Describe what happens to the dependent variable when the independent variable is changed.
In our example, what happens to the length of the plant when the temperature is changed?
Pattern: Do you see a pattern with the results? If there is no clear pattern, that’s ok! It’s part of the scientific method to take ambiguous results and think about how to get a clearer answer by repeating the experiment or asking another question to design another experiment.
In the plant growth experiment, is there a pattern to the plant growth when the temperature is increased or decreased?
Conclusion
The conclusion summarizes your findings from the experiment and requires careful thought.
Answer the following questions to draw conclusions from the experiment:
Do the results prove or disprove the hypothesis? Is there an alternative hypothesis that the results prove?
What is a possible explanation for the results? This may require research of published experiments and scientific theories on the topic. A good rule of thumb is to use Occam's razor, that is to go with the conclusion that uses the fewest assumptions.
How can the experiment be improved to better prove the hypothesis?
What other experiments can be done to gather more evidence to prove the hypothesis?
Are there new questions that have arisen from the experiment, result or analysis? This can be the starting point for a new hypothesis or new experiments to gather more evidence on the topic.
False positives and false negatives
When making conclusions, it's important to consider the possibility of false positives and false negatives. This means that the positive or negative result from an experiment may not be caused by the factor we are testing. Some experiments are more prone to false positives or false negatives than others. For example, medical tests are often designed to be very sensitive, which means that they are very good at detecting diseases, even if the disease is present in small amounts. However, this also means that some medical tests can produce false positives.
A false positive is a result that appears positive, but the positive result was not caused by the factor you are testing.
A false negative is a result that appears negative, but the negative result was not caused by the factor you are testing.
The way to confirm that a result is indeed a true positive or true negative is to do a different kind of experiment to verify the result. For example, if a medical test indicates that a person has a disease, the doctor may order additional tests to confirm the diagnosis.
Be aware of the possibility of false positives and false negatives when drawing conclusions from experiments. By understanding the limitations of experiments, we can make more informed conclusions from the information they provide.
Report
Scientific knowledge is meant to be shared so that science can progress and benefit everyone, no matter if you're participating in a science fair or doing scientific research in a laboratory.
Here are some ways scientific knowledge is shared:
Written reports:
Science fair projects can be written up as a report.
The findings of scientists are published in scientific articles in scientific journals, which are reviewed by other scientists. Peer review by the scientific community is an important check and balance to make sure that the scientific knowledge is trustworthy. Other researchers can learn from published experiments in scientific journals to advance science.
Posters & Talks:
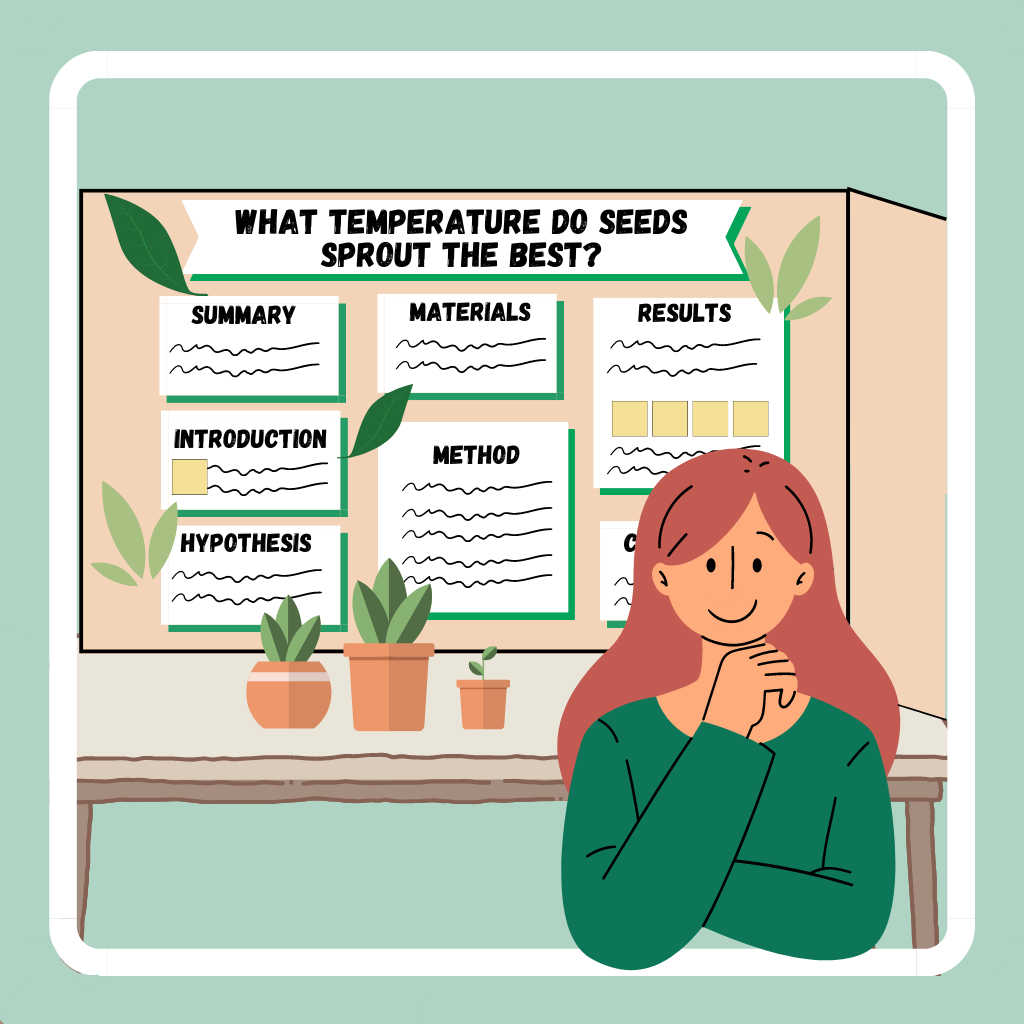
Science fair projects are often displayed on poster boards during science fairs, outlining the scientific process used in the project, which includes all the steps of the scientific method. Sometimes, the actual experiment can be displayed at the science fair as well. During the science fair, students and teachers usually read the posters and talk with students to learn more about their science fair projects.
Scientists present their findings at conferences, which are gatherings of scientists who share their research with each other. At conferences, scientists present posters and give talks to other scientists to share their findings.
By sharing scientific knowledge, we all help to advance our understanding of the natural world and to find solutions to the challenges we face.
 And a bonus step: Start the process again!
Often, experiments don't give us clear results, so it can be difficult to reach a solid conclusion. But don't worry, this is a normal and important part of scientific research! After all, the word "research" means to search again and again!
It takes persistence to gain a better understanding of the natural world. This often involves repeating the experiment or doing a different kind of experiment to approach the question from another angle. As you continue to use the scientific method to investigate the topic, the scientific theory will be refined, and you will improve your critical thinking and experimental design skills.
Scientific Method Example
 Now that we've gone through the 7 steps of the scientific method, let's examine a scientific method example from start to finish to see how the scientific method is used in a real-life example.
Observe and Question
 You may have noticed an abundance of plant growth in the spring, coinciding with rising temperatures. This raises the question: do plants grow better in warmer temperatures?
Research
 If you're curious what factors contribute to plant growth, a good place to start is researching key ingredients: sunlight, water, and soil.
With so many plant varieties that grow at different temperatures, it's best to focus on just one kind. Seeds that are available from store, such as radish seeds, are a good place to start.
Research the optimal season for radish seed growth, then determine the average temperature during that time. Knowing this will give you the best chance of success. Be sure to factor in the amount of time it typically takes for radish seeds to sprout, so you can plan accordingly and allow time for the experiment.
Hypothesis
The hypothesis can be stated as: “The hypothesis is that radish seeds will grow best at 80F, compared to lower or higher temperatures.”
Experiment
 Design the experiment so that it tests whether the hypothesis is supported or not. If you to find a sample experimental method as a reference, you can browsing other science fair projects or watching videos of similar experiments. From there you can change the method so that it tests whether your hypothesis is supported or not.
Independent variable & dependent variable - The temperature is the independent variable as it's changed in the experiment. The length of the radish sprout is what's measured in the experiment, so that's the dependent variable.
Control group & experimental group - Since you're trying to find the best temperature for the seeds to grow, there is no control group. Instead, you'll have an experimental group that includes all the seed growth experiments at the three different temperatures.
Positive control & negative control - There are no positive or negative controls for this experiment since you're only interested in finding the optimal temperature for sprouting the seeds.
Reproducibility - To ensure reproducibility, you can test 10 radish seeds together in one experiment at each temperature and record the average growth rate. If you want to repeat the experiment, you can set up the same experiment on another day.
Gather materials - After writing out the procedure for the experiment, gather all the necessary materials by listing them out and checking what you already have at home and what you need to borrow or buy.
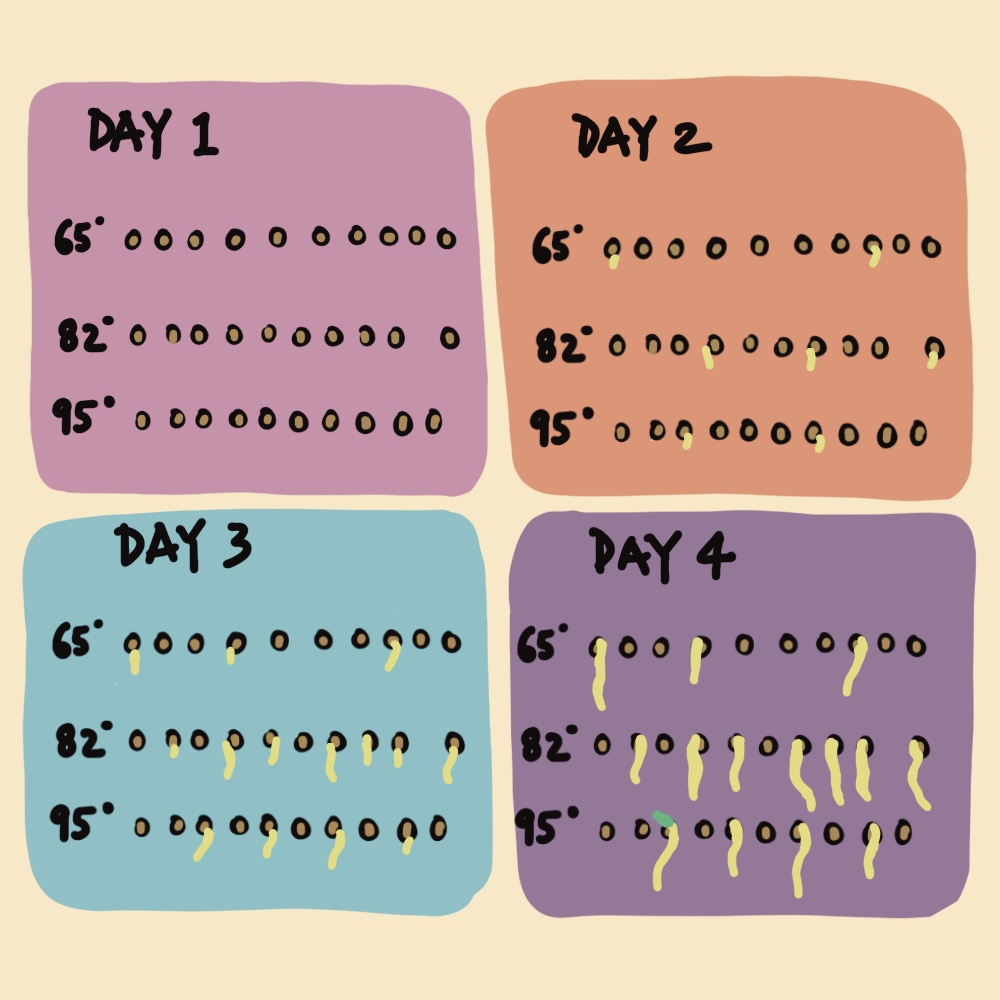
Collect data & careful observation - Set up the seeds to sprout in the different temperatures. Record the actual temperature (65F, 82F, 95F), the date and time of measurement, and any observations about the germinating seeds or experiment setup. Take accurate measurements.
Analysis
 After completing the experiment, you'll have measurements of the seed sprouts at the three different temperatures (65F, 82F, 95F) and any other observations you recorded.
Calculations: The final length of the 10 germinated seeds at each temperature can be averaged.
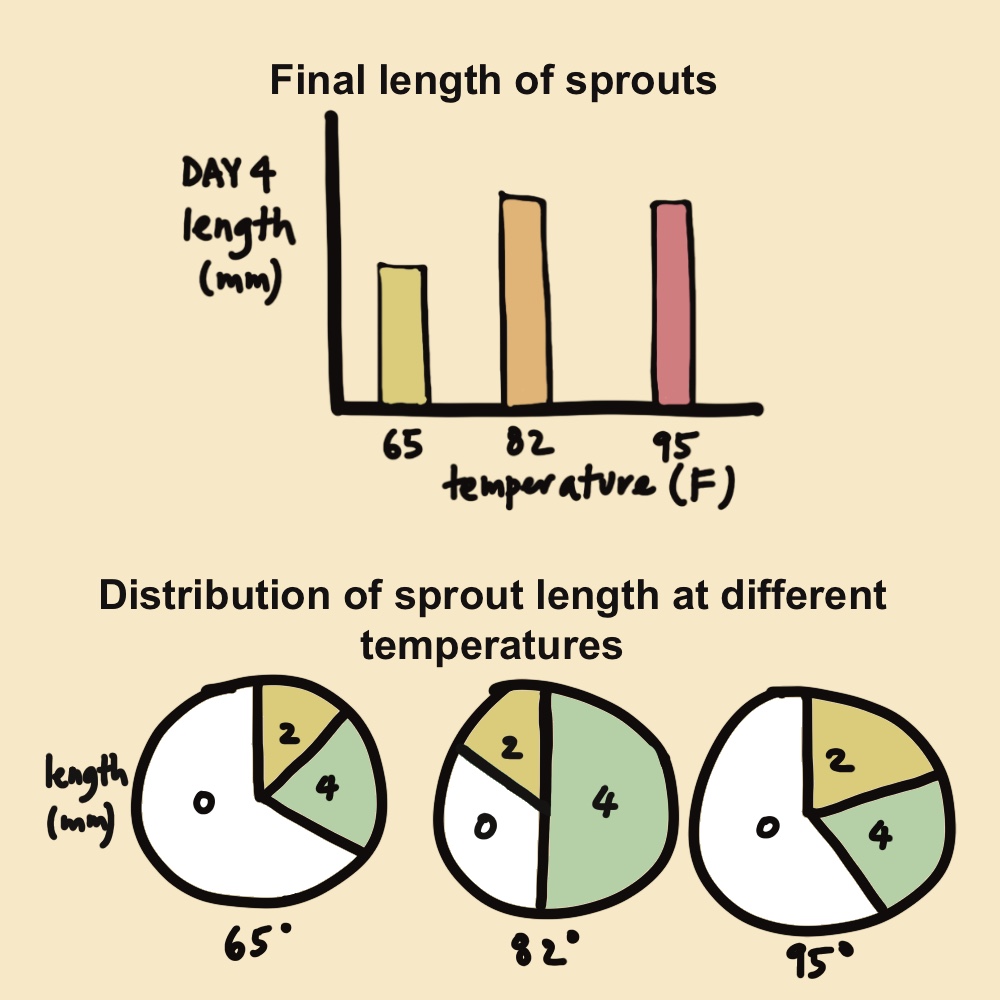
Organize data: You can plot the final average length of the seed sprouts at each temperature on a bar graph. This will allow you to compare the average length of the sprouts at each temperature.
Additionally, you can represent the length of each seed sprout for each temperature on a pie chart to see what happened to the 10 seeds. Comparing the pie charts from the three different temperatures will help you identify any patterns as the temperature changes.
Dependent and independent variable: The experiment did not reveal a clear pattern between increasing the temperature and how well the seeds sprout.
Pattern: From analyzing the pie charts, it is evident that the 82F experimental group had the most sprouted seeds with the longest length. Increasing or decreasing the temperature from 82F did not seem to improve seed germination.
Conclusion
Was the hypothesis proven or disproven? The hypothesis was proven in this experiment, as most seeds sprouted at 82F, and not at a lower or higher temperature.
Possible explanation? The warm temperature at 82F seems to be optimal for the radish seeds to grow. Lower or higher temperatures did not seem to provide better sprouting conditions.
Next steps: The statistics of the experiment could be improved by using more radish seeds in the experiments. Other types of seeds can be tested with this experiment to see if 82F is an optimal temperature for germinating other seeds. After determining the optimal temperature for seed germination, the experiment can be extended to test the optimal soil type.
Report
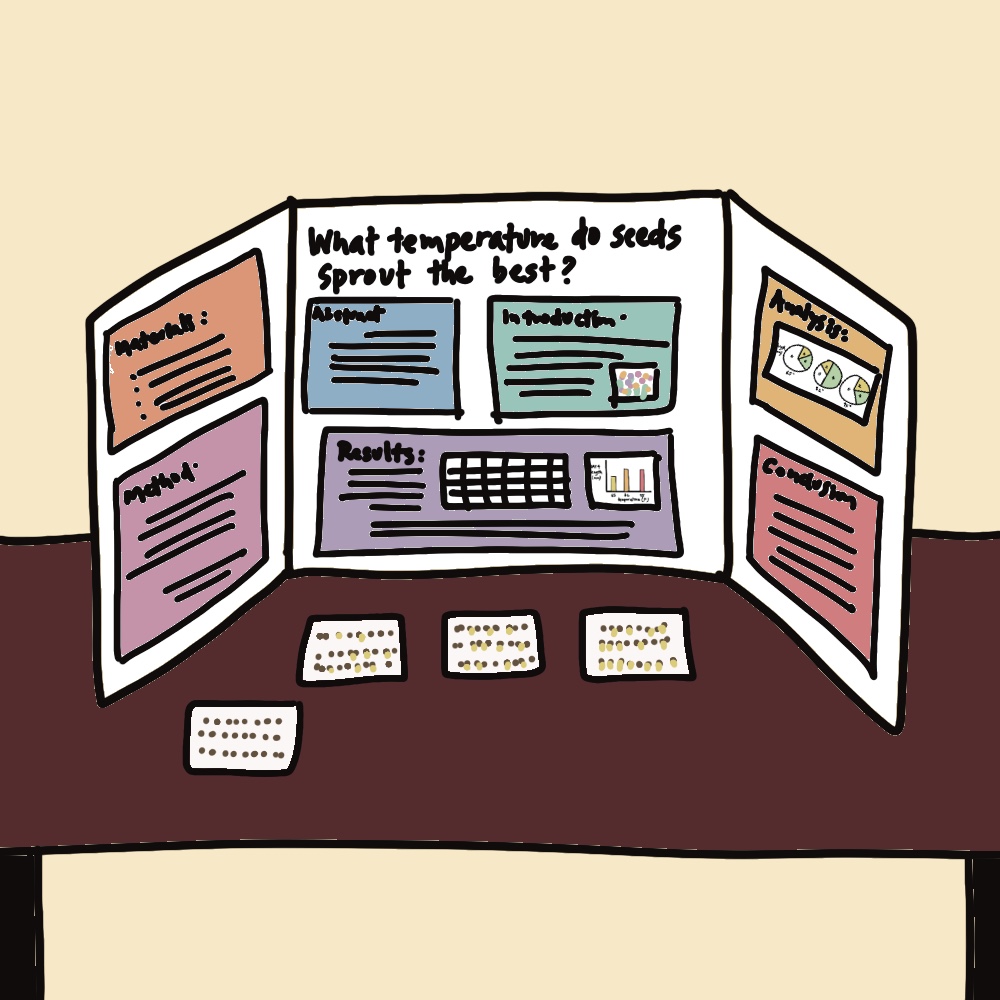 To present this science fair project, a poster board can be used, with each step of the scientific method as a separate section. You can also make the display more interactive and engaging by displaying pictures from the experiment or the actual germinating seeds on the table for people to see. This will help to captivate their attention and make the project more interesting for them to learn about. Our detailed science fair poster guide gives step-by-step instructions and tips.
Scientific Method History
How did the scientific method come about? Throughout history, people's curiosity about the natural world has led them to uncover truths about science, and in doing so, the scientific method has developed and evolved. Let's go back in time to see how the scientific method has been refined over time!
Ancient Greece: Aristotle
 Aristotle is considered one of the earliest scientists to use a systematic approach to scientific inquiry. He made careful observations of the natural world and used deductive reasoning to form theories. His approach was called the syllogistic method, which uses deductive reasoning to make specific predictions based on general rules.
While Aristotle did conduct experiments to observe nature, he did not manipulate the factors being observed. For example, he once removed an egg from underneath a hen and opened it each day to observe the development of a chicken embryo over time. However, many of Aristotle's theories were later proven incorrect because they were not rigorously tested with experiments and sometimes relied on imperfect logic and reasoning to draw conclusions.
16th and 17th centuries: Francis Bacon and Galileo Galilei
The scientific method made great progress in the 16th and 17th centuries, thanks to Francis Bacon and Galileo Galilei.
 Francis Bacon was an English philosopher and politician. The scientific process Bacon developed is also known as the Baconian Method. Bacon recognized the significance of doubting the interpretations of observations before assuming their validity. To verify a hypothesis, experiments needed to be conducted, and the outcomes should be repeatable.
He also stressed the importance of establishing the cause and effect in natural phenomena by altering factors and observing their consequences, providing a deeper understanding beyond passive observation as advocated by Aristotle. Bacon employed inductive reasoning, which involves using observations to reach a conclusion.
 On the other side of Europe in Italy, Galileo Galilei was a physicist, astronomer and engineer. Galileo developed a scientific inquiry method based on observation and experimentation. He believed that the natural world could be understood through careful observation and experimentation, and could be quantitatively described with mathematics. Using this method, he made several important discoveries such as the phases of Venus, the moons of Jupiter, and the laws of motion.
Unlike Aristotle and Bacon, he was more willing to challenge the prevailing thoughts of his time. Galileo stood firm on his beliefs and was charged with heresy for refusing to accept that the Earth was the center of the universe.
18th century: Isaac Newton
 Isaac Newton was an English physicist, astronomer and mathematician. Newton's scientific methodology was similar to Galileo's, but he was more systematic and rigorous in his approach. Newton developed a number of mathematical tools, such as calculus, which helped to make science more precise and provided a powerful new way of describing and understanding science. Newton's laws of motion and gravity revolutionized the field of physics and laid the foundation for many scientific advances in the centuries that followed.
19th century: Charles Peirce
 Charles Peirce was an American philosopher and scientist. Peirce is known for his work on abduction, which is forming a hypothesis to explain a surprising or puzzling observation based on evidence and reason. The hypothesis can then be tested through experiments and conclusions drawn from both inductive and deductive reasoning.
Peirce was also a founder of statistics, developing mathematical methods to analyze data. He believed that science can only predict things with a high chance of being true, but not with complete certainty. Peirce's work on hypotheses and statistics has helped to make science more open-ended and creative.
20th century:
 In the 20th century, the scientific method underwent further development. Scientists used advanced tools and computers to gather and analyze data, and focused on interdisciplinary methods to address complex problems.
As technological advances open up new ways of understanding science, it will be exciting to see how the scientific method continues to evolve to uncover even deeper scientific insights!
More from Science Fair Coach
Introduction to Science Fairs
 Discover the advantages of science fair projects, explore different science project types, and learn how to find and do a science fair project.
Science Fair Poster
 Follow our step-by-step guide to design and create an eye-catching poster that effectively displays your science fair project!
The Engineering Design Process
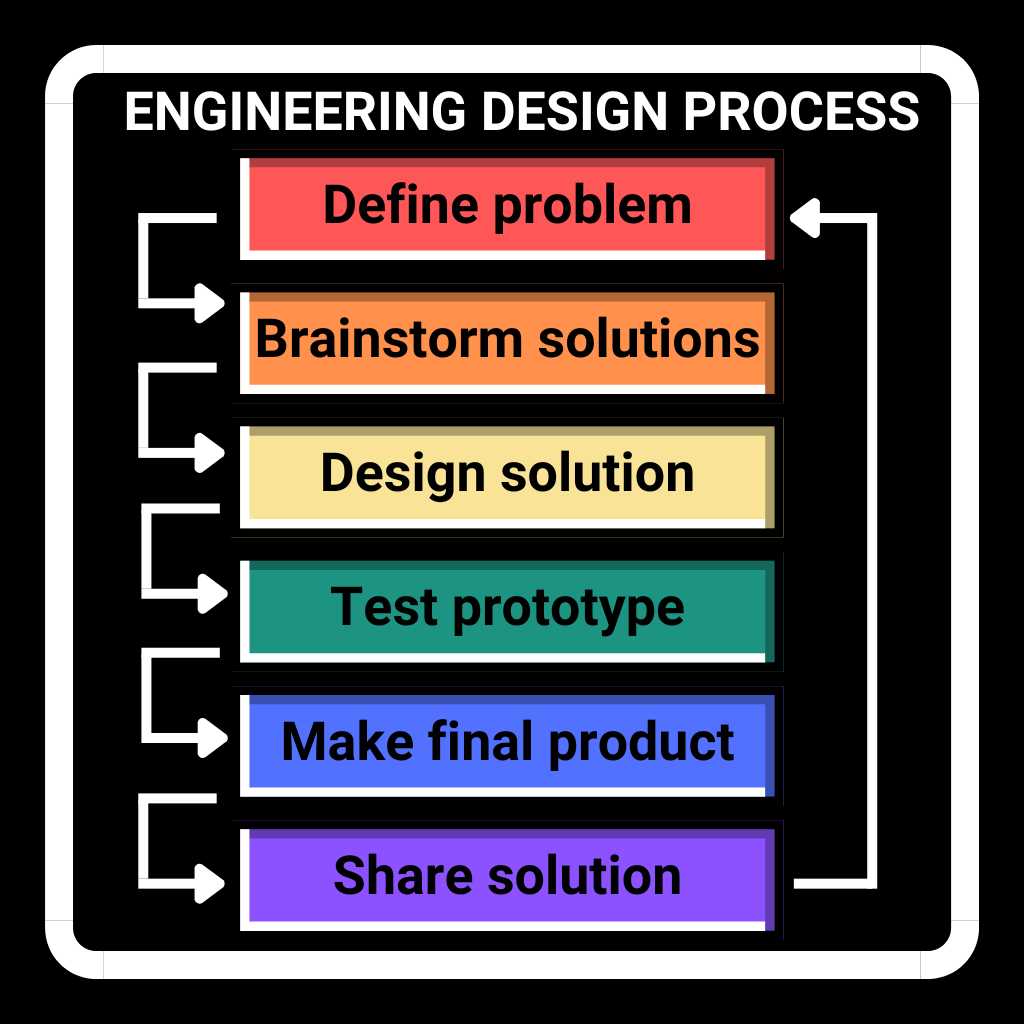 Learn the 6 steps of the engineering design process to make an effective solution to a problem, an example of the engineering process with the egg drop challenge, engineering challenges and engineering science fair projects!