| Complexity level: | 8 |
| Project cost ($): | 200 |
| Time required: | 1 day to prepare, 1 day for the science project experiment |
| Material availability: | Participation of drivers and 5 different cars are required. |
| Safety concerns: |
Hypothesis
Driving at 90 km/h (about 55 mph) produces better fuel economy than driving at 11 km/h (about 70 mph).
Overview
Speed and gasoline usage
A car’s fuel consumption refers to the amount of fuel required for the car to travel a specified distance. Similarly, fuel economy refers to the distance that can be traveled per unit of gasoline.
As the speed of a vehicle increases, the amount of wind resistance on the car also increases. At speeds of above 50km/hour, the effect of air resistance starts to increase very rapidly. About 30% of a vehicle’s power will be used to overcome the amount of wind resistance on the vehicle, when it is driven at speeds above 100km/hour.
Different vehicles will achieve their optimal fuel consumption at different speeds. When the vehicle's speed exceeds 90km/hour, fuel economy begins to decline. Slowing down from 110km/hour to 90km/hour will increase a car's mileage by between 20% and 30%.
Scientific Terms
Materials
The materials required for this science fair project:
- 5 drivers
- 5 types of cars
1. A Nissan Rogue
2. A Toyota Yaris
3. A Honda Civic
4. A Mazda 3
5. A Nissan Sentra
- 250 liters of gasoline (about 65 gallons)
Eureka Crate — engineering & invention kits for ages 12+ — monthly projects that build real-world skills. (Affiliate link)
See what’s includedProcedure
1. For this science fair project, the independent variable is the type of car and the speed of the car. The dependent variable is the distance traveled by the car on 20 liters (or 5 gallons) of gasoline. This is determined by observing and recording the odometer readings. The constants (control variables) are the amount of gasoline, the traffic on the highway, the car’s age and its maintenance.
2. The science project requires 5 cars and 5 drivers. The cars chosen were a Nissan Rogue, Toyota Yaris, Nissan Sunny , Mazda 3 and a Nissan Sentra
3. This science fair project will start by driving the cars to a gasoline station until the “Low Fuel” signal lights up. The cars are filled with 20 liters of gasoline each. The odometer is reset to zero.
4. For the first experiment, the drivers are made to drive their cars at a constant speed of 90km/h along the chosen stretch of highway. They are to continue driving at that speed until the “Low Fuel” indicator lights up again. The driver should then stop the car and record the distance traveled indicated by the odometer.
5. For the second experiment, the odometer is first reset to zero. The driver then continues to drive at 110km/h until he reaches the nearest petrol station where he refills the car with another 20 liters of gasoline. The driver then starts the return journey and continues to drive at 110km/h until the “Low Fuel” indicator lights up again. The driver then stops the car again and records the distance traveled indicated by the odometer.
6. The drivers must now drive to the nearest gasoline station and fill up another 10 liters of gasoline before returning home.
Results
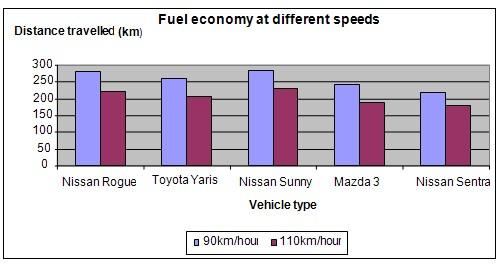
It is observed that at 90 km/h all of the cars were able to travel for longer distances (of about 20% to 30%) compared to when the cars travelled at speeds of 110km/h.
|
Vehicle type |
Distance traveled on 20 liters of petrol (km) |
Extra distance (in terms of %) |
|
|
90km/h |
110km/h |
||
|
Nissan Rogue |
281 |
221 |
27.1% |
|
Toyota Yaris |
260 |
205 |
26.8% |
|
Nissan Sunny |
285 |
230 |
23.9% |
|
Mazda 3 |
242 |
189 |
28.0% |
|
Nissan Sentra |
218 |
178 |
22.5% |
The chart below represents the results of our science experiment.
Conclusion
Our hypothesis has been proven to be correct. Driving at 90 km/h (about 55 mph) produces better fuel economy than driving at 11 km/h (about 70 mph).
As gasoline prices increase, the average consumer would look for ways to improve fuel efficiency and reduce consumption. From the above data, driving at 55 mph instead of 70mph helps to reduce our gasoline consumption.
Also consider
Repeat the science project, this time, using vehicles with higher engine capacities.
The science project experiment can be repeated using different grades of gasoline.
References
Fuel economy in automobiles - http://en.wikipedia.org/wiki/Fuel_economy_in_automobiles
Fuel efficient driving - http://www.eartheasy.com/live_fuel_efficient_driving.htm