Search for Science Fair Projects

1000 Science Fair Projects with Complete Instructions

The Big Mac Economy

The Big Mac Economy

Hard
Share this Science Project:
This page contains full project details. For the summary, please see the Project Summary.

Science Fair Project Description

This survey was done to discover the relationship between the price of a Big Mac hamburger and the GDP per capita of a country.
Complexity level:9
Project cost ($):10
Time required:1 day to prepare, 2 days for the science project experiment
Material availability:Access to the internet
Safety concerns:NA

Hypothesis

As the GDP per capita of the country increases, the price of the Big Mac also increases.

Overview

Big Mac Index

The Big Mac is a standard burger that is sold in all Macdonald’s franchise restaurants across the world at different prices. The prices seem to be adjusted to suit the affordability of the local consumers (amongst other factors) in a particular country.

Theoretically, since the price of a Big Mac has been fixed based on affordability, demand and supply, it may perhaps, to a certain extent be used to compare and justify the currency exchange rate between 2 countries. For example:

The Big Mac is priced in the USA atUS$2.90, The Big Mac’s price in Thailand = Baht 70

Purchasing Power Parity (PPP) = US$2.90/ 70 = 0.0414

Currency exchange rate: 0.0327 US$ = Baht 1 (estimated)

To calculate whether the Thai Baht is undervalued or not against the US dollar:

(0.0327 – 0.0414)/0.0327 x 100% = -26.6%

A negative figure means that the Baht is theoretically undervalued against the US dollar (in this case, by 26.6%).

Scientific Terms

GDP, per capita, foreign exchange rates

Materials

The materials and information required for this science project:
- GDP per capita of various countries
- Price of Big Mac in various countries
- A computer to help analyze the data

Procedure

1. A list of 10 countries will  be used  for the survey. To simplify the analysis, the selection of the countries will be made based on the GDP per capita, so that the result will reflect a broad range of poor  and rich countries.

2. Research the GDP per capita for various countries on the internet. Once the figures are obtained, the 10 countries are selected and they are recorded in the table below.

3. The price of the Big Mac burger in each of the countries is next searched for on the internet. The result of the search are also recorded in the table below.

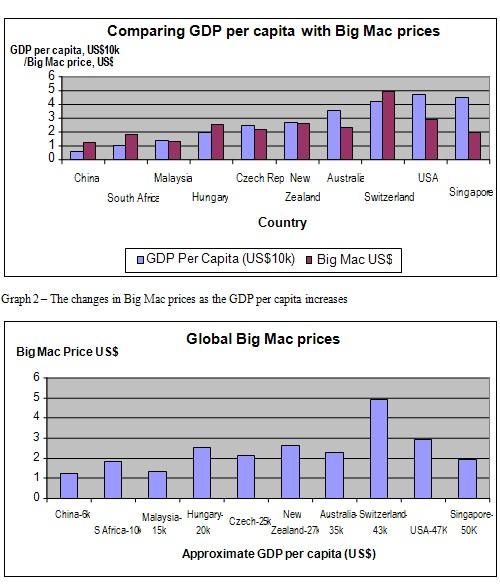
4. Based on the data, the first chart is created to compare the ratio of GDP per capita to the price of the Big Mac in each country. To do this the GDP per capita is converted to per unit of US$10K. The chart is then plotted with the GDP per capita figures and Big Mac prices, side by side for each country, as shown in chart 1.

Big Mac science fair project 
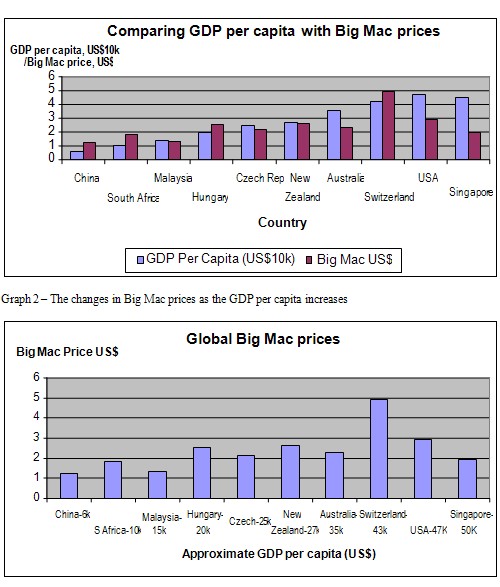
5. The second chart is created to observe how the price of the Big Mac will change against the increasing GDP of various countries. The data for the countries is arranged along the X-axis with increasing GDP as shown in chart 2. The price of the Big Mac for each country is then plotted.

6. The data and the charts are now ready for analysis.

b1.jpg

Results

The finding , shown  in  chart 1, is that in  countries  with  a GDP per capita income  that is less than US$25K, typically the price of the Big Mac is greater, than the GDP per capita income, per US$10K. For the countries with a higher GDP per capita, the price of the Big Mac is less  than the GDP per capita income, per US$10K. The only exception is Switzerland.

Chart 2 shows that increasing the GDP per capita income does not have much influence on the Big Mac selling price in the particular country.

Country

GDP per capita income (US$)

Price of Big Mac (US$)

China

5,962

1.26

South Africa

10,109

1.86

Malaysia

14,215

1.33

Hungary

19,329

2.52

Czech Republic

24,712

2.13

New Zealand

27,027

2.65

Australia

35,677

2.27

Switzerland

42,534

4.90

USA

46,716

2.90

Singapore

49,288

1.92

The charts below help us visualize the data in our table.

Chart 1- Comparing Big Mac prices (US$) to per capita income (US$10k) of different countries

Chart 2 – The changes in Big Mac prices as the GDP per capita increases

Conclusion

Our hypothesis has not been proven to be true. As the GDP per capita of the country increases, the price of the Big Mac does not necessarily increase.

The currencies of some countries are undervalued or overvalued due to foreign exchange trading. The Big Mac Index was created to test the exchange rates in an informal way, by comparing the buying power of consumers in different countries using the Purchasing Power Parity (PPP).

Also consider

The project can be repeated by comparing prices of other international food chains like Pizza Hut or Burger King.

Try to repeat the project to compare prices for countries within Asia and countries within Europe.

References

Big Mac index - http://en.wikipedia.org/wiki/Big_Mac_Index

Food for thought – the Big Mac Index - http://www.cfo.com/article.cfm/3014203?f=home_todayinfinance

Related video

Hey there! Here are some awesome videos about this science project that we think you'll really like. They're not only super fun, but they'll also help you learn more about the science behind the project. So sit back, relax, and get ready to have some fun!!
Share this Science Project:

Related Science Fair Project Ideas

Does Sample Size Matter?
Do you want to find out if the number of people you survey affects the accuracy of the results?
Hard
Streaks in Baseball: A Mystery?
Have you ever wondered why baseball teams sometimes go on winning or losing streaks? Let's find out if it's just luck or something else!
Hard
Testing the Bell Curve
Can you predict the probability of a marble falling into a certain slot? Find out with this fun experiment!
Hard