Search for Science Fair Projects

1000 Science Fair Projects with Complete Instructions

Does Sample Size Matter?

Does Sample Size Matter?

Hard
Share this Science Project:
This page contains full project details. For the summary, please see the Project Summary.

Science Fair Project Description

This science fair project was conducted to ascertain if increasing the sample size of participants in a survey can produce more accurate results. The science fair project was done by determining the number of left-handed persons among 100 participants, 200 participants, 300 participants, 400 participants and 500 participants.
Complexity level:4
Project cost ($):10
Time required:1 hour to prepare, 5 days for observation
Safety concerns:Basic safety requirements

Hypothesis

As the number of participants increase, the results of the survey will be more accurate.

Overview

Statistics

Statistics is the mathematical science of making use of data collected from experiments or individuals. It involves the process of collecting required data from surveys or experiment results, analyzing them and interpreting the data. A person who is well versed in statistical analysis and theapplication of data is called a statistician.

The researcher performing the survey decides the size of the data sample required. Normally, the larger the sample size, the more accurate the resultswill be. A smaller sample size will produce a less accurate result. The chosen sample size will also depend on the amount of time available for data collection, the budget and the accuracy of the result required.

The accuracy of the result will also depend whether the selection of participants is carried out in a truly random fashion. Choosing a pool of participants who are biased will only produce one-sided results. In this case, a larger sample size may not produce more accurate results.
 

Scientific Terms

Statistics, mathematical, statistical analysis

Materials

The materials required for this science fair project:

-    500 students age 15
-    An assistant
-    5 copies of  a permission letters sent to the administration of 5 different school
-    5 survey forms (one for each school)

Procedure

1.    For this science fair project, the independent variable is the number of students surveyed i.e.100, 200, 300, 400 and 500 students. The dependent variable is whether the students are right-handed or left-handed. This is verified by performing a simple test of dropping a pencil and observing which hand each student uses to catch it. The constants (control variables) are the age of the students and the number of students tested from each school.

2.    Permission is sought from the administration of 5 schools to perform a random test on 100 students who 15 years of age. You will need to obtain the necessary permission before beginning any testing at the school.

3.    When you visit the school, you should do so with your assistant. Ensure that you pre-arrange an appropriate time and venue to conduct your testing - you should enlist the help of the school administration.

4.    Testing procedure: Have each student tell you their name and age. Have your assistant record these details on the survey forms. The survey forms should contain a table of 100 rows, and 3 columns. Next, a pencil is held in front of each student, whilst the student stands hand by his/her side, and he or she is asked to catch it on the count of 3. When you drop the pencil, observe which hand the student uses to catch the pencil. The observation is recorded in the form. After completing the test on all the students, the number of students that used their left hand is calculated and the results recorded in the table below. Also, the percentage of left-handers in the school is calculated. You should record the percentage of left-handers for the first 10 students tested, then the first 50, and subsequently, the first 100.

5.    Procedure 4 is repeated in the remaining four schools. At the end of the experiment  the results of the tests done on the previous days are added to the daily result. This is done so that the total number of students that were surveyed will accumulate from 100, 200, 300, 400 to 500  The new percentage of left-handers are calculated and recorded in the table below.
 

b1.jpg

Results

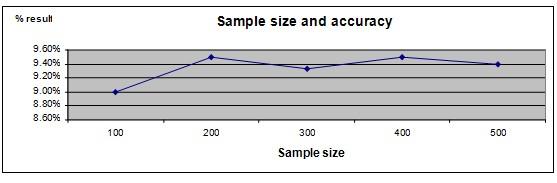
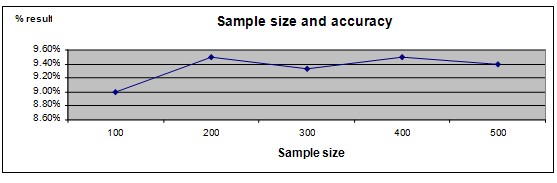
It is observed that as the sample size of the participants increases, the results become more accurate.

Condition Sample size and accuracy of results
  10 50 100 200 300 400 500
Number of lefthanders 2 7 12 19 28 38 47
% of left hander 20% 14% 12.00% 9.50% 9.33% 9.50% 9.40%

Use the below graph to plot the results of above observation.
 

statistics science fair project

Conclusion

The hypothesis that as the number of participants increases, the results of the survey are more accurate, is correct.

Statistics is a very powerful tool that is used in science, economics, human behavior, engineering and many more applications. Businesses conduct consumer surveys regularly to collect data that can be used to analyze and predict the future expectations and demands of consumers. Independent bodies like Gallup Poll conduct political surveys to predict election results.
 

Also consider

Try to repeat the science fair project using other surveys, for example surveys to determine the number of students that wear eyeglasses, or who have had their wisdom teeth extracted .

What if the sample size were to be increased significantly (for example, over tenfold) Do you think there will be any difference in your results? What if you were to vary your experiment, by holding the pencil near the student's right hand. Do you think you'll see any difference in your results?

References

Statistics - http://en.wikipedia.org/wiki/Statistics

Sample size and accuracy - http://science.jrank.org/pages/5952/Sample-Sample-size-accuracy.html
 

Related videos

Hey there! Here are some awesome videos about this science project that we think you'll really like. They're not only super fun, but they'll also help you learn more about the science behind the project. So sit back, relax, and get ready to have some fun!!
Share this Science Project:

Related Science Fair Project Ideas

The Big Mac Economy
Ever wondered why the Big Mac costs different amounts in different countries? Let's find out!
Hard
Streaks in Baseball: A Mystery?
Have you ever wondered why baseball teams sometimes go on winning or losing streaks? Let's find out if it's just luck or something else!
Hard
Testing the Bell Curve
Can you predict the probability of a marble falling into a certain slot? Find out with this fun experiment!
Hard