Search for Science Fair Projects

1000 Science Fair Projects with Complete Instructions

Sleep Hours and School Performance

Sleep Hours and School Performance

Hard
Share this Science Project:
This page contains full project details. For the summary, please see the Project Summary.

Science Fair Project Description

This survey was done to find out the relationship between the number of hours a student sleeps in a day and his performance at school, school attendance, extracurricular activities, non-school activities and overall health.
Complexity level:8
Project cost ($):30
Time required:1 day to prepare, 14 days for the science project experiment
Material availability:Easily found
Safety concerns:

Hypothesis

A ;Lack of sleep will have adverse effects on the performance of students.

Overview

Effect of sleep deprivation

Adults and children require between seven and eight hours of sleep every night. However most studies and surveys conducted on high school students show that they only sleep about 6.5 hours a day.

Sleep allows the body to recuperate and grow. Dead cells are replaced, damaged neurons are repaired and the brain gets the rest that it requires. The tired body gets refreshed and energized whilst we sleep.

Adolescents typically require even more sleep due to the psychological and physical changes that their minds and bodies experiencing during this phase of their lives. Being deprived of sleep during one's adolescent years leads to mental, physical and social problems amongst these children.

Children deprived of sleep are observed to have a poorer memory, reduced alertness and are slower to respond. They also get irritated easily, lack concentration, socialize less and are unable to handle complex duties.

A lack of sleep also reduces the white blood cells in the body, causing the body’s immunity to be weakened and vulnerable to infection. This in turn leads to many health related problems.

Scientific Terms

Recuperate, psychological, physical, white blood cells

Materials

The materials required for this science project:

- 20 male and 20 female students 15 years of age
- consent forms
- A desktop or notebook computer, to help analyze your data
- Permission from the school administration

Procedure

1. For this science project, the independent variable is the amount of sleep that the students get every day. The dependent variable is the performance of the students in various categories – average grades, average sick leave, average absenteeism, extracurricular activityiesand out of school activities. This is determined by analyzing the data obtained from the students. The constants (control variables) are the selected age group, the timing of the survey (during the exam or before a sports tournaments) and the location of the school (urban or rural).

2. Permission is obtained from the school administration to perform this science project and to also gain access to some of the students’ confidential information.

3. Start by randomly picking two groups of 20 boys and 20 girls all aged 15 years.  They are each given a form (table 1) to fill  about their sleep pattern, health problems, school attendance, extracurricular activities and out of school activities for the next 2 weeks.

Table 1 – Table used to source student data


Name
 

Age
 

Average grade


Day


Hours of sleep the night before


Indicate if sick or on medical leave


Indicate if absent from school


Extracurricular activity (if any)


Out of school activity (if any)


Day 1


Day 2
         
 .....          


Day 14


4. After  2 weeks,  the forms  are collected  and submitted to the school administration , in order to verify the students’ grades and attendance records.

5. The verified  forms  are collected  from the school administration for analysis. The data on the students’ sleep patterns is categorized into the following groups :

a. less than 6 hours

b. between 6 to 7 hours

c. between 7 to 8 hours

d. over 8 hours

6. The average grade, sick leave, absenteeism, extra curricular and out of school calculated and their average scores calculated, according to the 4 groups above.

b1.jpg

Results

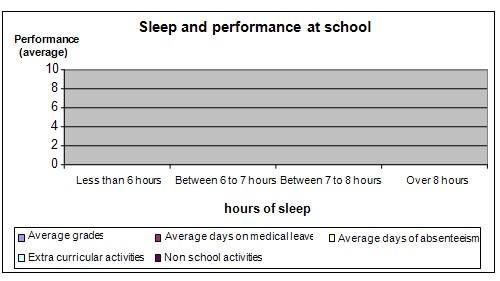
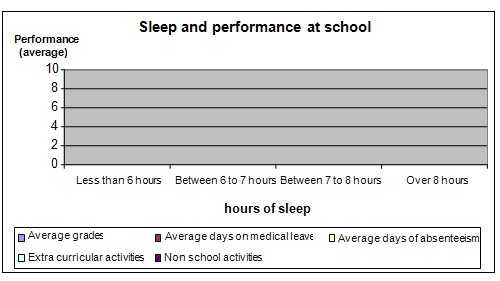
Do your resultsshow that there is a correlation between the lack of sleep and the student's grades? You will probably discover that students who have less sleep tend to perform more poorly on average.

Table 2 – Average sleep and performance at school

Average hours of sleep

Average grades

Average days on medical leave

Average days of absenteeism

Extra curricular activities

Non school activities

Less than 6 hours


Between 6 to 7 hours


Between 7 to 8 hours


Over 8 hours


Use the graph below  to plot the results of your analysis.

sleep and academic performance science project

Conclusion

You should be able to ascertain from the data gathered that the hypothesis is true.  The lack of sleep usually causes a student’s grades and health to decline.

Students need a lot of sleep, especially during their teenage years when the body is growing very quickly and undergoing many changes.

Also consider

The science project can be repeated by using a larger pool of students over a longer period of time to obtain better averages results.

Try to modify the project to compare the performance of students from urban schools and schools in rural areas.

References

The dramatic link between sleep and student performance –http://www.publicschoolreview.com/articles/83

Adolescent sleep needs and school performance - http://nysut.org/research/bulletins/981202adolescentsleep.html

Related videos

These videos explain the science behind this project and demonstrate key concepts used in the experiment.
Share this Science Project:

Related Science Fair Project Ideas

Peer Pressure and Conformity
Set up a secret quiz experiment and discover whether people pick a wrong answer just to match the group.
Hard
Classroom Temperature and Test Scores
Test the same group of participants on reading comprehension at 20°C, 25°C, and 30°C to find the temperature where scores peak.
Hard
Gender and Peer Pressure Response
Plant ten people who give wrong answers on purpose and watch whether male or female participants are more likely to follow along.
Hard