Search for Science Fair Projects

1000 Science Fair Projects with Complete Instructions

Friction and Speed

Friction and Speed

Medium
Share this Science Project:
This page contains full project details. For the summary, please see the Project Summary.

Science Fair Project Description

This science fair project was done to find out how road surface conditions affects the speed of a moving car. The testing was done using 3 types of model cars on 5 different types of surfaces.
Complexity level:6
Project cost ($):30
Time required:1 hour to prepare, 1 day for the science fair project experiment
Material availability:Easily found
Safety concerns:None

Hypothesis

Cars move faster on a fine surface and more slowly on a coarse surface.

Overview

Friction and motion

A wheel will start to roll when a linear force is applied to it, provided there is a resistive force present to prevent the wheel from sliding on the surface. This resistive force is called static friction or also known as wheel traction.

The wheel will start to roll forward if the static friction at the contact point is higher than the force from the torque of the wheel. However, if the force of torque is higher than the static friction, the wheel will spin and the static friction will now become kinetic friction. The wheel may still roll forward, but at a slower speed.

Friction is very important to allow a to wheel start its rolling motion, to help the rolling motion stop and to also change the rolling speed of the wheel. As the wheel starts to roll forward, the wheel and the ground will experience surface deformation due to their elastic properties. This will produce rolling friction which will cause the forward velocity of the wheel to reduce. Energy is also lost as heat when the two surfaces are continuously being deformed by compression and relaxed.

Scientific Terms

Friction, linear force, resistive force, static friction, kinetic friction, traction, torque, rolling motion

Materials

The materials required for this science fair project:
- a ramp (at least 2 meter long)
- 3 types of model cars
- 7 pieces of sand paper ISO Grit size P100
- 7 pieces of sand paper ISO Grit size P80
- 7 pieces of sand paper ISO Grit size P60
- 7 pieces of sand paper ISO Grit size P40
- 7 pieces of sand paper ISO Grit size P20
- 1 stopwatch
- 1 ruler
- 1 assistant
- 1 roll of masking tape

Procedure

1. For this science fair project, the independent variable is the surface condition of the ramp  (sand paper grit sizes of 100, 80, 60, 40 and 20 are used to create different surface conditions). The dependent variable is the time taken by the model car to travel 2 meters down the ramp. This is determined by measuring the time taken with a stopwatch. The constants (control variables) are the degree of elevation  of the ramp, the length of the ramp, the surface condition of the ramp and weight of the cars.

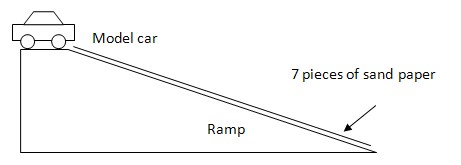
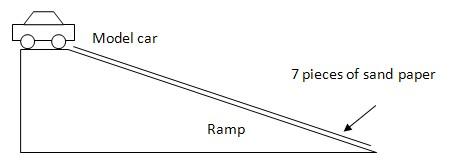
2. The science project experiment is set up as shown in figure 1 above. The start and finish lines  are marked using  masking tape. The total distance traveled will be 2 meters.

3.  7 pieces of the grit p100 sandpaper are arranged in a straight line on the 2 meter long ramp. The surface of the sand paper will represent the roughness of the floor surface and the amount of friction on the tire of the model car. The sand paper is fixed on the surface of the ramp with masking tape.
friction and speed science project
4. The first car to be tested is placed on the ramp and with the help of an assistant, the time taken for the car to roll down the 2 meter long ramp is  recorded with a stopwatch. The test is repeated 3 times and the average time taken is calculated and recorded in the table below.

5. Procedure 4 is repeated using the other 2 types of model cars and the average time taken is calculated and recorded in the table below.

6. Procedure 3, 4 and 5 are repeated using sandpaper with grit sizes of 80, 60, 40 and 20. The average time taken is calculated and recorded in the table given below.

b1.jpgb2.jpg

Results

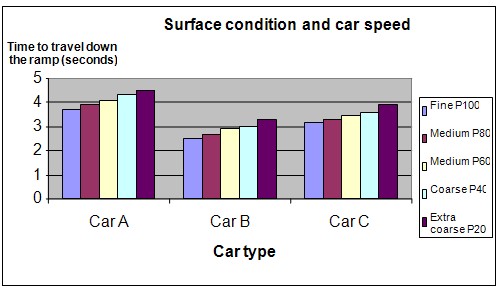
The results showed that as the surface of the ramp became more coarse, the cars  took a longer time to travel 2 meters down the ramp.

Model car type

Sand paper grit and time taken for the model car to travel down the ramp (seconds)

Fine P100

Medium P80

Medium P60

Coarse P40

Extra coarse P20

Car A

3.7

3.9

4.1

4.3

4.5

Car B

2.5

2.7

2.9

3.0

3.3

Car C

3.2

3.3

3.5

3.6

3.9

The graph below represents the results of our science project experiment.

friction science project

Conclusion

Our hypothesis, that cars move faster on a fine surface and more slowly on a coarse surface.

Also consider

This science fair project may be repeated, this time, by using remote controlled cars.

Modify the science project experiment, increasing the gradient of the ramp in order to increase the speed of the car.

References

Role of friction in starting rolling motion - http://www.school-for-champions.com/science/friction_rolling_start.htm

Rolling friction - http://webphysics.davidson.edu/faculty/dmb/py430/friction/rolling.html

Related videos

Hey there! Here are some awesome videos about this science project that we think you'll really like. They're not only super fun, but they'll also help you learn more about the science behind the project. So sit back, relax, and get ready to have some fun!!
Share this Science Project:

Related Science Fair Project Ideas

Crash Barrel Effectiveness
Can paper cups filled with water and sand absorb more impact during a collision? Find out in this science project!
Medium
Riding the Slope
Are you ready to race? Find out if cyclists or runners are faster on hills with different inclines!
Medium
Water Strider Challenge: Make a Bug Walk on Water!
Can you make a pipe cleaner foil bug walk on water? Find out with this engineering challenge by building your own water strider and exploring the science of surface tension.
Medium