| Complexity level: | 8 |
| Project cost ($): | 30 |
| Time required: | 1 hour to prepare, 2 days for the science project experiment |
| Material availability: | Access to basic laboratory equipment required. |
| Safety concerns: |
Hypothesis
Overview
Scientific Terms
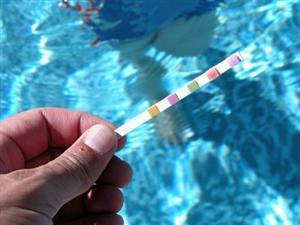
Materials
Eureka Crate — engineering & invention kits for ages 12+ — monthly projects that build real-world skills. (Affiliate link)
See what’s includedProcedure

Results
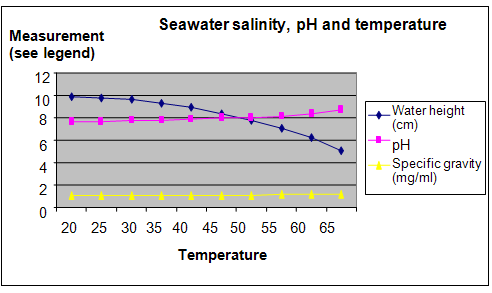
The level of water fell as the temperature of the seawater increased indicating a higher rate of evaporation. The increasing temperature also increased the specific gravity and the pH of the seawater after 24 hours.
|
Measurement |
Seawater condition with increasing temperatures measured after 24 hours |
|||||||||
|
20 °C |
25 °C |
30 °C |
35 °C |
40 °C |
45 °C |
50 °C |
55 °C |
60 °C |
65 °C |
|
|
Water height (cm) |
9.9 |
9.8 |
9.6 |
9.3 |
8.9 |
8.4 |
7.8 |
7.1 |
6.2 |
5.1 |
|
pH |
7.65 |
7.70 |
7.75 |
7.80 |
7.85 |
7.95 |
8.05 |
8.15 |
8.30 |
8.70 |
|
Specific gravity (mg/ml) |
1.025 |
1.030 |
1.040 |
1.055 |
1.075 |
1.090 |
1.110 |
1.140 |
1.160 |
1.210 |
The graph below represents the results of our science project experiment:
Conclusion
Also consider
References
Related videos
These videos explain the science behind this project and demonstrate key concepts used in the experiment.
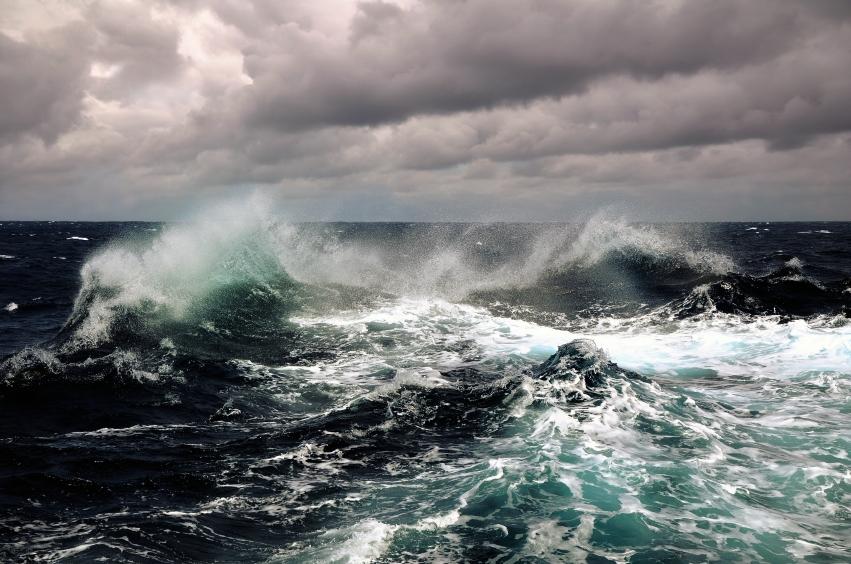
As a marine biologist in the Maldives explains, rising ocean temperatures have far-reaching consequences for our precious marine ecosystems. This includes the devastating effects on coral reefs, changes in wave patterns, increased erosion, and the survival of various ocean species. It's a heartbreaking reality that we must take action to address before it's too late.
National Geographic's video brings attention to the global coral crisis, revealing the heart-wrenching reality of the devastating effects caused by rising ocean temperatures - just one of the many far-reaching impacts of climate change. This serves as a critical reminder of the urgent need to protect our planet's delicate ecosystems.