| Complexity level: | 9 |
| Project cost ($): | 30 |
| Time required: | 1 hour to prepare, 2 days for the science project experiment |
| Material availability: | Easily found |
| Safety concerns: |
Hypothesis
There is a higher percentage of obese African-Americans students than Caucasian students, within the age band of 15 to 18 years..
Overview
Obesity
Obesity happens when a person has so much fat in his body that his health is affected and his life expectancy is reduced. Among the health problems associated with obesity are hypertension, heart disease, diabetes and difficulty in breathing.
One of the simplest ways to determine if a person is obese is to calculate the Body Mass Index (BMI).
BMI = [weight (kg)]/ [height (m) x height (m)]
BMI less than 18.5 – underweight
BMI between 18.6 until 24.9 – normal
BMI between 24.9 until 29.9 – overweight
BMI more than 30.0 – obese
Obesity happens due to excessive consumption of food and too little exercise. Sometimes it can also be due to genetic factors or even a very low metabolic rate. This is the reason why sometimes people put on weight despite eating small amounts of food. Other reasons include eating too much, physical inactivity, eating out too often and excessive consumption of sweetened drinks/junkfood.
Scientific Terms
Materials
The materials required for this science fair project:
- 50 African-American boys aged between 15 and 18 years old
- 50 African-American girls aged between 15 and 18 years old
- 50 Caucasian boys aged between 15 and 18 years old
- 50 Caucasian girls aged between 15 and 18 years old
(for more reliable results, ensure that the participants live in the same city and attend the same school)
- A measuring tape
- A flat wall
- A weighing machine
- 1 roll of masking tape
Procedure
1. For this science fair project, the independent variable is the racial type of the participating students – African-American or Caucasian. The dependent variable is the BMI of the participant. This is determined by measuring each participant’s height and the weight to calculate his/her BMI. The constants (control variables) are the age of the participant and the number of participants for each group.
2. The measuring tape is fixed on the wall with masking tape. The weighing machine is also placed close by so that the weight of the participant can be recorded immediately after checking the height.
3. The participants are separated into 4 groups as follows :
a. 50 African-American boys
b. 50 African-American girls
c. 50 Caucasian boys
d. 50 Caucasian girls
4. The height of each participant is measured in meters and their weight is measured in kilograms. Using the formulae provided above, the participants’ BMI is calculated. The BMI value will indicate whether the participant is obese.
5. The number of obese participants in each group is counted and recorded in the table given below. The percentage of the obese persons in each group is calculated and recorded in the table below.

Results
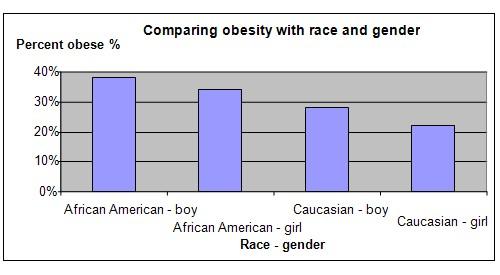
In our experiment, it was observed that there was a higher percentage of obese African-Americans than Caucasians. There was 38% obesity amongst African American boys and the 34% amongst African-American girls. In contract, there were 2% obese Caucasian boys 22% obese Caucasian girls.
|
Race and Gender |
Number of Obese |
Under/Overweight, normal |
Percent obese % |
|
African-American - boy |
19 |
31 |
38% |
|
African-American - girl |
17 |
33 |
34% |
|
Caucasian - boy |
14 |
36 |
28% |
|
Caucasian - girl |
11 |
39 |
22% |
The chart below represents our findings.
 0
0Conclusion
The hypothesis that there is a higher percentage of obese African-Americans teenagers between ages 15 and 18, compared to Caucasians of the same age, is proven to be true.
The main treatment for obesity is the control of food intake by dieting and burning of calories by exercising. This is normally supplemented with medication to reduceone’s appetite and decrease the percentage of fat absorbed. Sometimes surgery is also performed to help a patient reduce weight.
Also consider
For more reliable results, we should conduct the survey across several schools as well as several towns/cities. The results for a particular school or even a particular town/city may deviate from the norm.
Compare the rate of obesity amongst Hispanic-Americans and African-Americans.
You could also compare the waistlines of the participants.
References
Obesity - http://en.wikipedia.org/wiki/Obesity
Obesity and overweight statistics - http://www.in.gov/isdh/20158.htm
Obesity - http://www.holisticonline.com/remedies/weight/weight_obesity-introduction.htm

