| Complexity level: | 7 |
| Project cost ($): | 60 |
| Time required: | 1 day for preparation, 1 day for observation |
| Material availability: | You will require transportation to the various river locations |
| Safety concerns: |
Hypothesis
Overview
Scientific Terms
Materials
Tinker Crate — science & engineering build kits for ages 9–12 — real tools, real experiments, delivered monthly. (Affiliate link)
See what’s includedProcedure
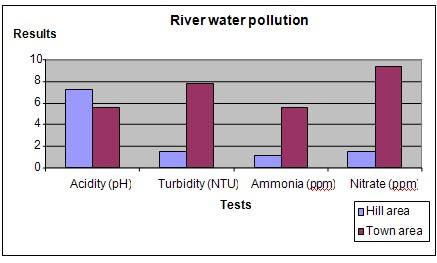
Results
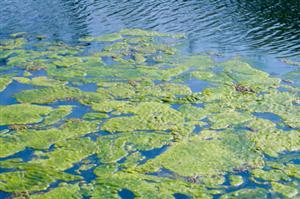
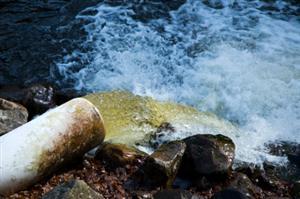
The acidity of the downstream water samples is higher than that of the upstream water samples . The turbidity , ammonia content and nitrate content of the downstream water samples is also higher.
| Water samples | Tests done on water samples (Averages for each sample type) | |||
| Acidity (pH) | Turbidity (NTU) | Ammonia (ppm) | Nitrate (ppm) | |
| Upstream | 7.2 | 1.5 | 1.2 | 1.5 |
| Downstream | 5.6 | 7.8 | 5.6 | 9.3 |
Plot your results into a graph as shown below.

Conclusion
Also consider
References
Related videos
These videos explain the science behind this project and demonstrate key concepts used in the experiment.